riskmetric
A risk model for Bitcoin DCA — band and cycle risk, shipped as a live dashboard.
The question is plain: at today’s price, how much risk is a dollar-cost-average buyer actually taking on Bitcoin? The honest answer lives in public data — price history, cycle structure — but it isn’t read off a chart at a glance.
riskmetric reconstructs that read from first principles, so the signal is reproducible rather than asserted.
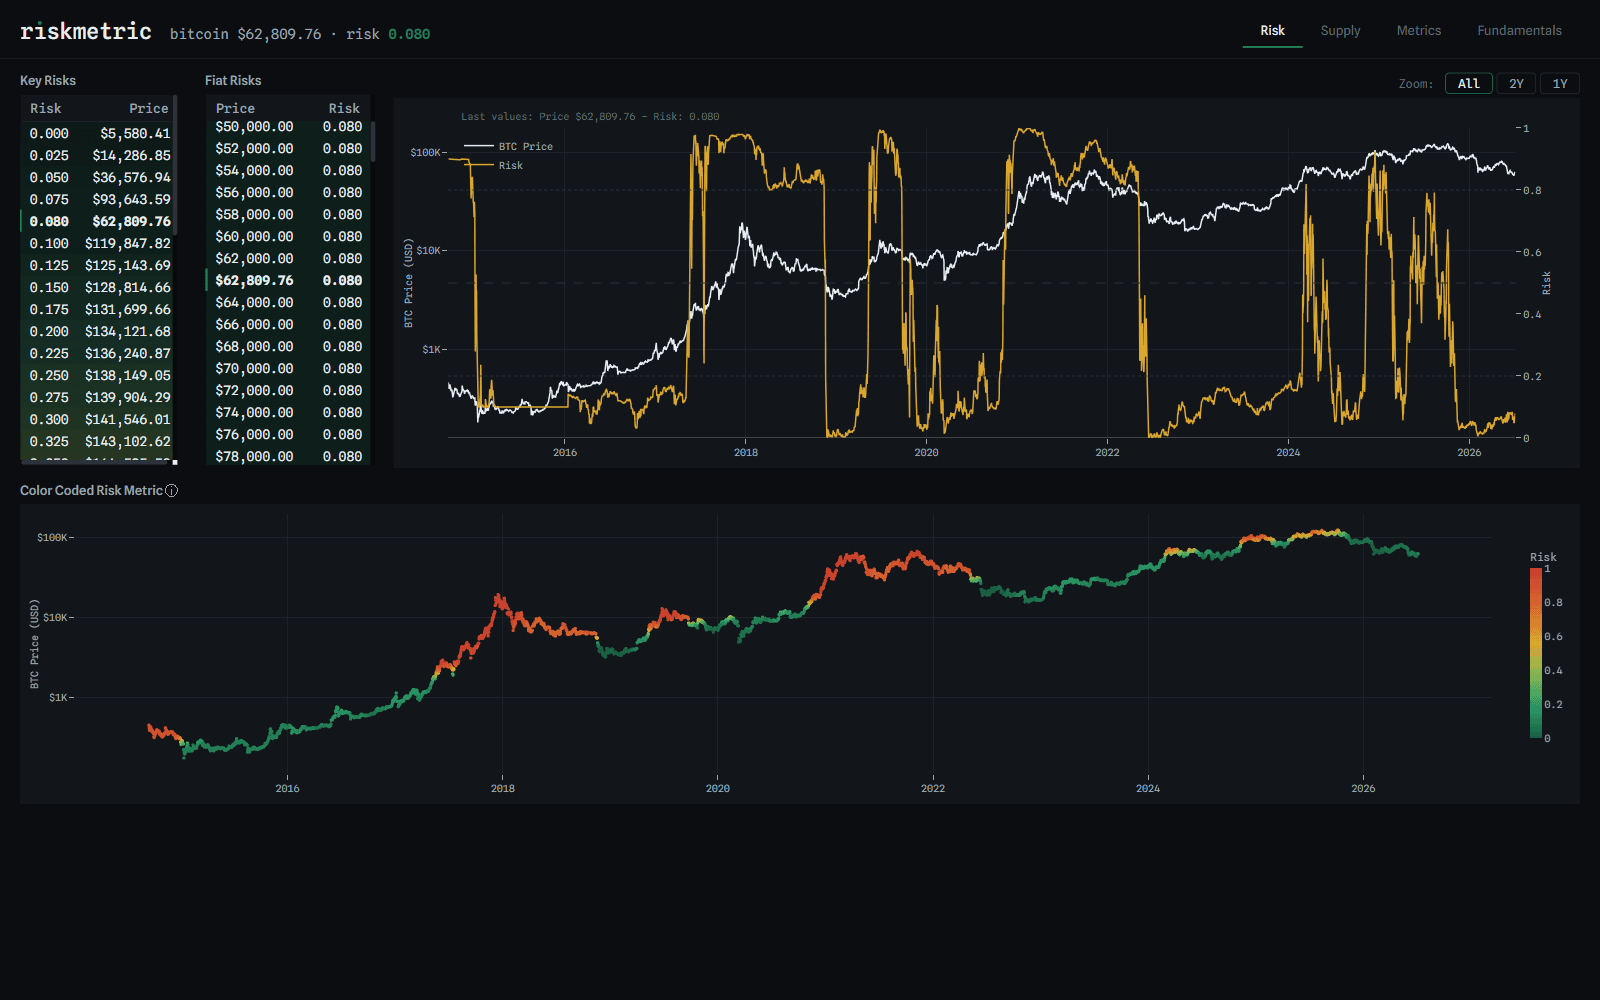
A power-law fair-value regression sets the spine. Around it, band risk and cycle risk are scored into a single normalised read — calm where the model says calm, elevated where it doesn’t.
A scheduled pipeline refreshes the inputs daily, so the number on screen is never stale and never hand-touched.
the dashboard refreshes itself — no hand on the wheel
A live dashboard that updates itself: band and cycle risk, the current read, and the fair-value context behind it.
The logic is legible end to end — every read traces back to the inputs that produced it. It earns trust the way a ledger does.